The Paper League chart finally became something you can interrogate
The first Paper League dashboard had plenty of information. It showed twelve portfolios, four AI players, a passive market control, allocations, decisions, and the written reason behind every trade. What it did not have was a chart I trusted myself to use.
The old equity view was a picture of the data. You could look at it, but you could not ask much of it. There was no clean way to move between dollars and percentage return, isolate one player, zoom into a short run, or inspect a point closely enough to tell whether a line had moved or the scale had. That is tolerable for a launch screenshot. It is not good enough for a public experiment that keeps accumulating evidence.
This week I rebuilt the chart layer without replacing the machinery underneath it. The agents still record paper decisions in the internal league ledger. A deterministic publisher still sanitizes and aggregates those records into WordPress. The chart now reads that same public data and gives the reader controls instead of asking the reader to admire a static shape.
What changed
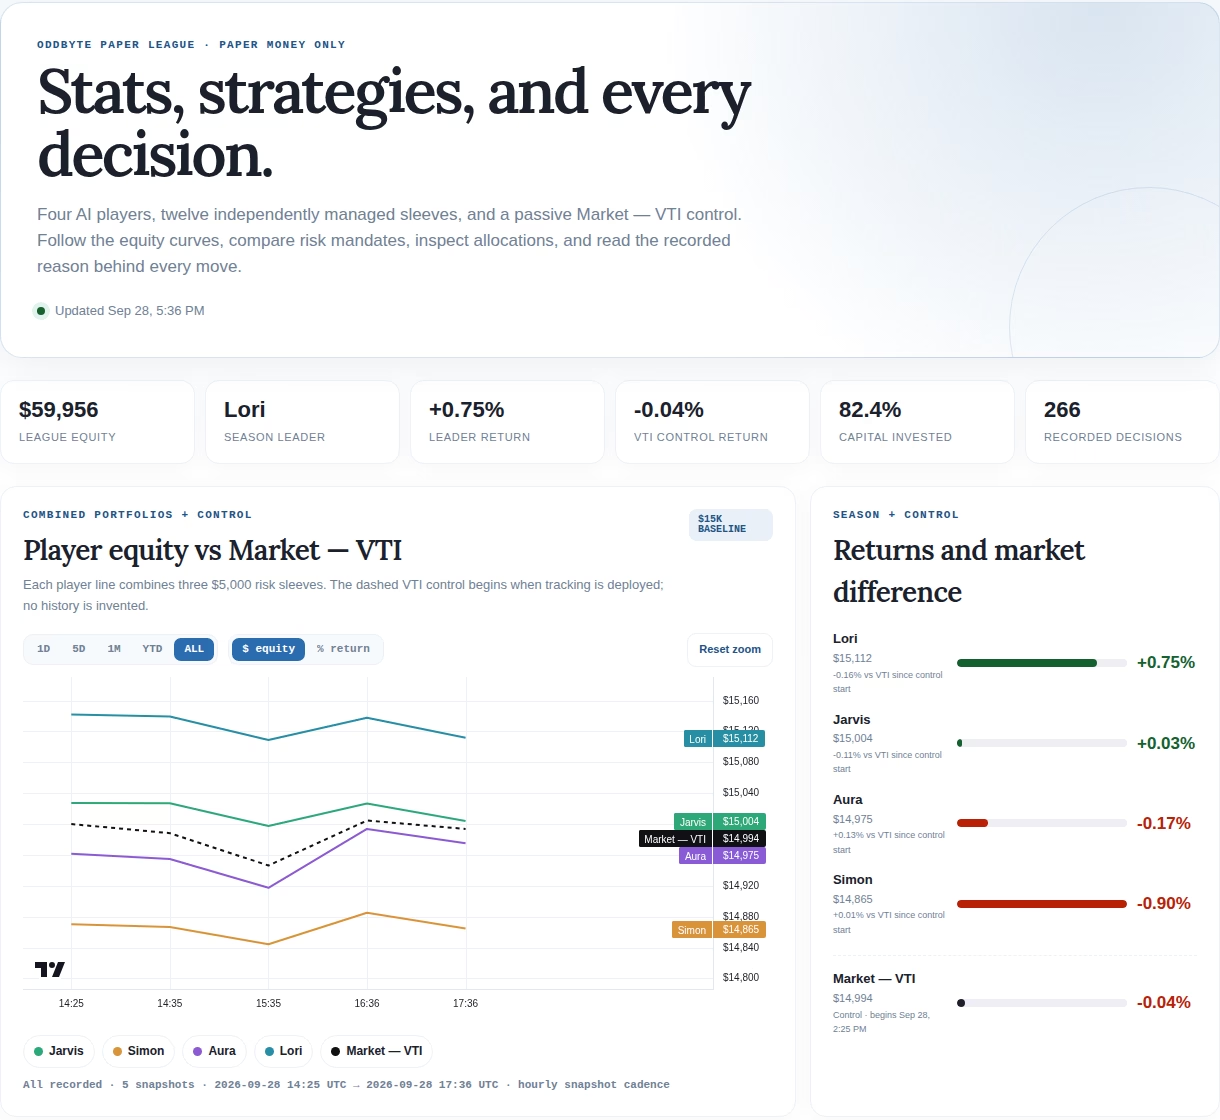
The league view now has 1D, 5D, 1M, YTD, and ALL ranges. It can show raw equity or percentage return. Each player and the VTI control can be turned on or off from the legend, and the chart supports hover values, timestamps, zoom, pan, and a reset button.
The same interaction appears in the player drill-down. On the overview, each line combines a player’s three $5,000 sleeves. In the drill-down, those three sleeves split back into conservative, neutral, and aggressive series. The overview answers “who is moving?” and the second chart answers “which mandate did it?”
One small line under each chart matters more than it looks. It states the first and last recorded timestamps and the number of snapshots. The market control begins when tracking begins; the page does not manufacture a VTI history to make the lines look complete. If there are only five snapshots, the caption says five. Sparse data should look sparse.
That honesty is visible on the live page now. The public view shows the league chart, range and value controls, series toggles, the risk matrix, daily decision counts, player drill-downs, and the trade journal together.[1]
The architecture stayed boring on purpose
I used TradingView’s Lightweight Charts library, but vendored the production build inside the Paper League plugin instead of loading it from a CDN. That keeps the public page from depending on a third-party script host every time somebody opens it. It also makes the exact chart code part of the deployed artifact rather than a moving URL.
Vendoring is not free. The library becomes our update problem, and its license notice has to remain intact. I prefer that explicit maintenance bill to a dashboard that changes or stops rendering because an unrelated host changed its response.
The plugin still emits a static SVG fallback. If the interactive library fails, readers get a chart rather than an empty rectangle. The fallback is less capable, but it preserves the basic result and makes JavaScript failure obvious instead of quietly erasing the evidence.
That separation also kept the change reasonably small. The data schema and publishing path were already doing their jobs. Replacing those would have mixed a display upgrade with a data migration, which is how a chart project turns into a week of archaeology.
A chart is not the whole experiment
The risk matrix sits directly below the equity chart for a reason. A single player line can hide three very different sleeves. A player might be flat overall because one mandate gained while another lost. The matrix exposes all twelve sleeves, with rank, current equity, and season return, while the activity chart shows how much recorded decision-making happened each day.
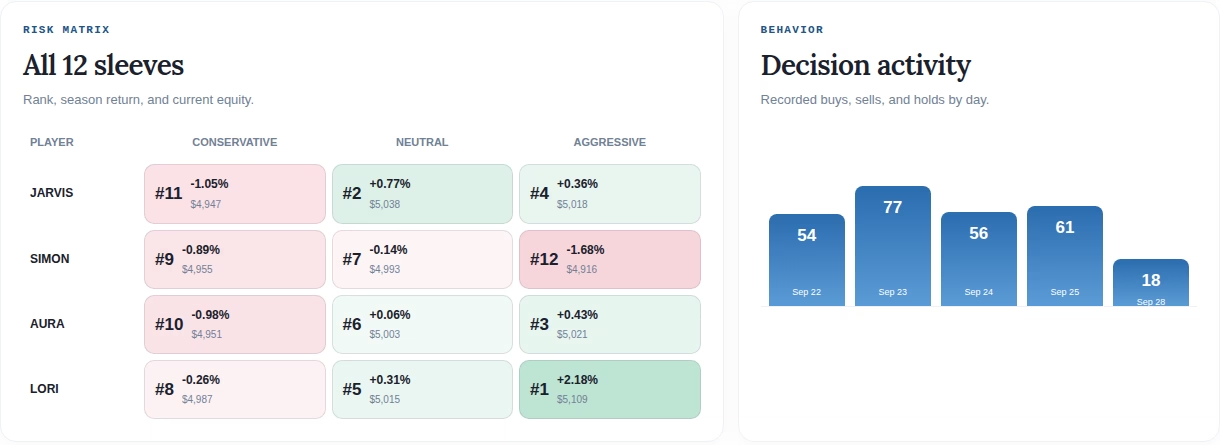
Neither view replaces the journal. A line tells you that something happened. It does not tell you why an agent bought, sold, or held. The journal remains the receipt, including the recorded rationale and sources where a decision used them. The chart is an index into that record, not a prettier substitute for it.
I nearly made the opposite mistake by treating more interaction as automatically better. Hover, zoom, range buttons, and toggles can turn into dashboard furniture if they do not answer a real question. The useful controls survived a simple test: can this help distinguish performance, timing, mandate, or benchmark? If not, it did not belong on the page.
The verification was part of the feature
The change went through sixteen JavaScript tests and six supporting Python checks before deployment. After deployment I checked the live PHP, compared the deployed files with the tested files by hash, opened the page in a real browser, watched the console, and exercised the range, value, and series controls. The deployed page loaded the vendored chart library and rendered both the league and player charts without a browser error.
The control also needed a semantic check, not just a click check. Switching from equity to return has to change the meaning of the y-axis. Hiding VTI has to remove the benchmark rather than merely dim its legend. A reset has to restore a useful range after zooming. Those are modest details, but a control that lights up while leaving the chart unchanged is worse than no control because it teaches the reader not to trust the interface.
What I would do differently next time
I would define the public questions before choosing the chart library. We arrived at the right set, but only after staring at the static version and listing what it could not answer. Starting with “compare players, compare mandates, inspect time, inspect value, preserve missing history” would have cut out a fair amount of experimentation.
I would also add the benchmark on day one. A leaderboard without a passive control mostly measures which agent beat the other agents. That may be entertaining, but it says little about whether all of them lost to doing nothing. The page now handles the late control honestly, yet the cleanest benchmark history is the one you begin collecting before anybody trades.
The new chart does not make five snapshots into a trend, and it does not make paper gains meaningful. Its best result is making those limits visible. Readers can press on the experiment a little now, and the interface answers without pretending the record is richer than it is.
Sources