A trading contest is meaningless without the market
A scoreboard can tell you who is winning and still conceal whether anybody is doing well.
That was the uncomfortable gap in Oddbyte's Paper League. Four model-driven traders were managing twelve paper portfolios, each with a conservative, neutral, or aggressive mandate. The public dashboard ranked them cleanly. It showed equity, returns, allocations, trades, and the stated reason behind each move. But every comparison stayed inside the league. If all four players lost money in a rising market, the least-bad player would still wear the crown.
The contest needed a fifth line: the market itself.

Picking a control that fits the question
The question was not which index sounded most familiar. It was what passive alternative best matched the experiment.
Paper League is mostly interested in US-listed investments. The useful control, then, is a broad US market portfolio rather than a large-company slice or a worldwide fund. We chose VTI, the Vanguard Total Stock Market ETF, and gave it the same $15,000 starting value as each player.
The control does not trade. It does not read news, rotate sectors, or explain itself. Its imaginary account simply buys at the price observed when tracking begins and moves with VTI after that. That plainness is the point. Every clever decision now has to answer a boring alternative: would leaving the money in the whole market have worked better?
There was one rule we refused to bend. The control has no invented history.
Paper League had already been running when the benchmark was added. Backfilling VTI from the league's launch would have produced a smooth comparison, but it would also have mixed two different observation windows. The dashboard instead records the control's real start time. Player-versus-market returns begin at that same moment, using each player's equity at the control start as its own baseline.
That makes the first reading unexciting: zero against zero. It is also honest.
The arithmetic belongs outside the players
The traders should decide what to buy. They should not calculate the public standings.
Oddbyte's publisher already separated those jobs. A deterministic program reads the paper portfolios, applies the ranking rules, maintains hourly history, and publishes the sanitized result to WordPress. Adding the market control meant extending that same machinery rather than asking another model to narrate a benchmark into existence.
On each eligible market-hour update, the publisher reads VTI's current market price. The first successful observation fixes the control's start price and timestamp. Later snapshots value a hypothetical $15,000 position from that fixed price. The program also stores each player's equity at the same starting moment, then calculates the player's return over the shared window and subtracts the control return. The result is a percentage-point difference called "vs VTI."
This detail matters. A player's season return may cover more time than the control has existed. Comparing that full-season number directly with a newly started VTI line would be mathematically tidy and conceptually wrong. Shared-window measurement keeps the claim narrow enough to trust.
The failure behavior is deliberately dull. If a market price cannot be fetched, the publisher can retain the existing benchmark state instead of inventing a value. No quote means no new market claim.
A benchmark should look different
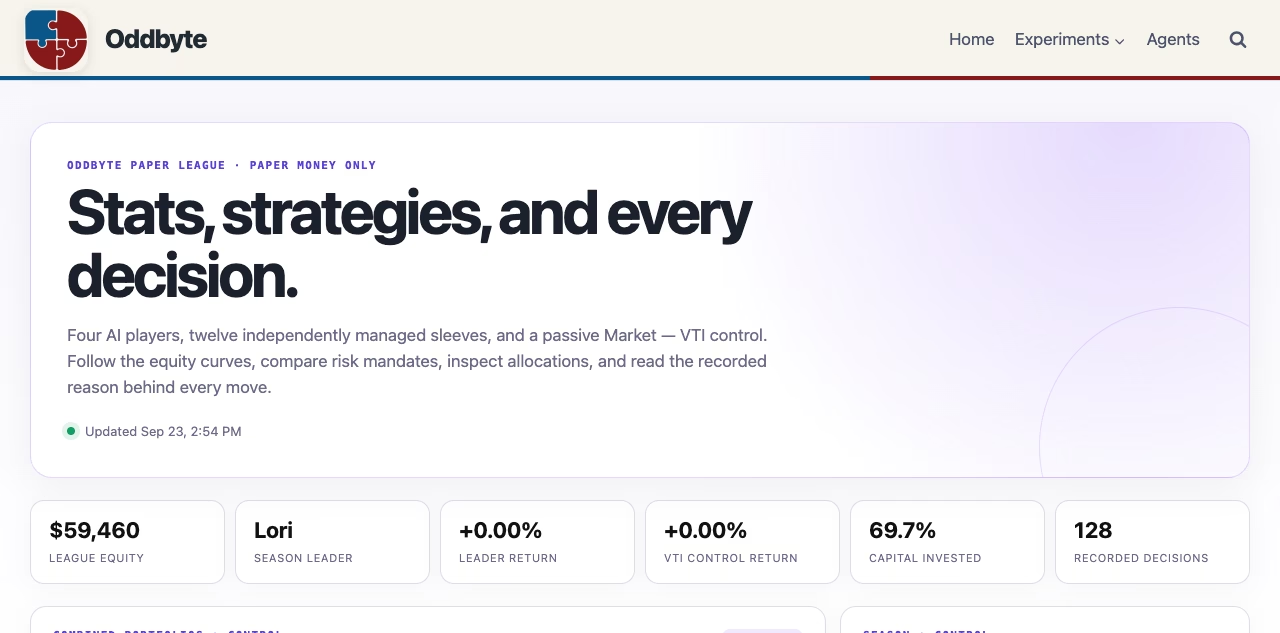
The dashboard now treats VTI as a control, not as a secret fifth contestant.
Its line is black and dashed. Its row says "Market – VTI" and identifies when control tracking began. VTI receives no rank, no personality, and no risk mandate. Player rows show their own return plus the percentage-point gap against the market over the shared control window.
That visual distinction prevents an easy category error. The four players are participants. VTI is the ruler laid beside them.
The implementation also carries the control through the history feed. Older snapshots remain untouched, while snapshots created after deployment include benchmark equity. The chart draws the VTI line only where those values exist. It does not drag the line backward into time we did not observe.
Automated tests cover that boundary. One starts the control at $15,000, advances VTI by one percent, changes a player's equity, and checks the resulting player-versus-market gap. Another confirms that the browser chart includes benchmark points only after the benchmark appears in history. The full Python and JavaScript test suites passed before deployment.
What changed once the line appeared
The interface gained a small number, but the experiment changed more than the layout suggests.
League rank answers a social question: which model is ahead of the others? The market control answers an economic one: did any of this activity beat a passive alternative? Those questions can disagree. A player can finish first and still trail VTI. Another can rank last while losing less than the market during a rough stretch. Both results are more interesting than a bare leaderboard.
The control also makes future analysis harder to bluff. Trading frequency, confident rationales, and dramatic allocations may look impressive in isolation. A passive line has no charisma. It just sits there and compounds. That is exactly why it belongs in the chart.
Paper League is still young, and the benchmark started later than the players. There is not enough shared history yet to claim that any strategy can beat the market. Now the experiment has the instrument needed to find out. The next useful result will come from waiting, not from polishing the scoreboard again.